Tourism Nova Scotia gathers and reports tourism statistics on behalf of the tourism industry. These statistics help inform our decision-making, help describe visitors to Nova Scotia, and can be used by tourism businesses and organizations for planning and business development. As tourism indicators are compiled from several sources, data becomes available at different times. Tourism Nova Scotia reports the most up-to-date statistics available so reporting timelines for each indicator may differ.
Year-to-Date July 2023
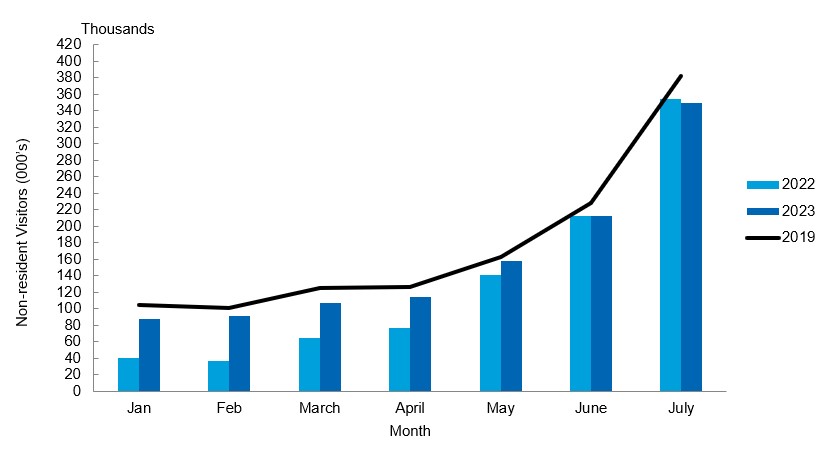
Month of July 2023
Following a strong start to the year, visitation to Nova Scotia softened somewhat in July 2023. Nova Scotia welcomed 349,000 visitors, down 4% (13,000 fewer visitors) from July 2022, and down 8% (32,000 fewer visitors) compared with July 2019.
Nova Scotia saw 14,000 fewer visitors from Canada (with declines coming primarily from Western Canada), and 2,000 fewer visitors arrived from overseas markets. Meanwhile 4,000 more visitors arrived from the US compared with July 2022.
232,000 visitors arrived by road in July 2023, down 3% (7,000 fewer road visitors) compared with July 2022, and down 16% (44,000 fewer road visitors) compared with July 2019.
117,000 visitors arrived by air in July 2023, down 5% (6,000 fewer air visitors) compared with July 2022. This marks the first time since February 2021 that monthly air visitation has declined compared with the same month one year earlier. Relative to 2019, air visitation continues to grow, with air visits up 11% (11,000 more air visitors) over July 2019.
Year-to-Date July 2023
Year-to-date July 2023, a total of 1.1 million visitors have come to Nova Scotia, an increase of 19% (178,000 more visitors) compared with the same period in 2022, and a decline of 9% (109,000 fewer visitors) compared with the same period in 2019.
Of those visitors, 708,000 arrived by road (up 20% over the same period in 2022 and down 17% compared with 2019). Meanwhile, 413,000 visitors arrived by air (up 18% over the same period in 2022 and up 10% over 2019).
The data indicates that while 2023 visitation is stronger compared with 2022, Nova Scotia is not expected to reach 2019 levels of visitation this year. The most important contributor is visitation from Atlantic Canada. Visitation from Atlantic Canada is up significantly as of July 2023 compared with 2022, but remains the slowest to recover, and is down 17% (108,000 fewer visitors) from 2019. In addition, visitation from the US, although up 18% this year compared with 2022, remains well below 2019 levels (down 32%, or 35,000 fewer visitors compared with 2019).
Visitation from Ontario, which typically comprises one-quarter of visitation, is up 9% compared with 2022, and up 8% compared with 2019 (24,000 more visitors).
Nova Scotia experienced significant wildfires in the spring of 2023, followed by a historic rainfall and flooding event across parts of the province in the summer. Both received media coverage outside the province, and Tourism Nova Scotia continues to assess the potential impact of these and other recent weather-related events, as well as the impact of inflation and air access, on travel to the province.
Non-resident Visitors to Nova Scotia:
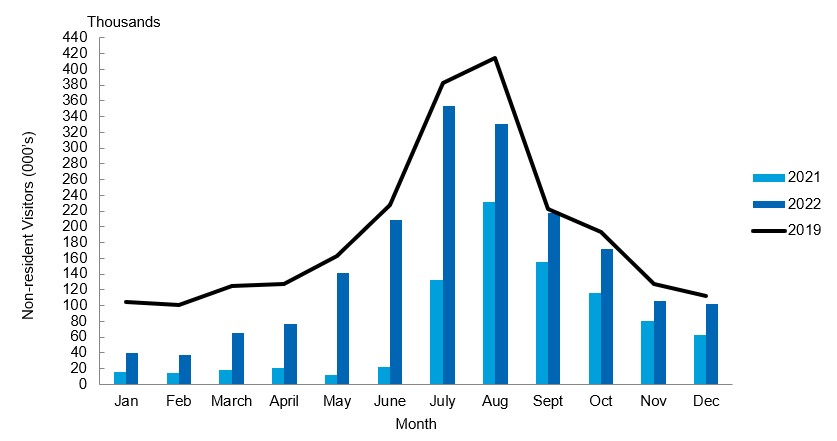
2022 Visitation to Nova Scotia
Visitation to Nova Scotia recovered substantially in 2022, with Nova Scotia welcoming 1.9 million visitors, an increase of 1 million visitors compared with 2021. Visitation did not reach pre-pandemic levels, with 2022 representing a decline of 18% (or 415,000 fewer visitors) compared with 2019.
Of those visitors, 1.2 million arrived by road (up 82% compared with 2021 and down 25% compared with 2019). Meanwhile, 725,000 visitors arrived by air (up 198% compared with 2021 and down 4% compared with 2019).
Although Atlantic Canadians continued to represent the largest share of visitors, accounting for 41% of overall visitation in 2022, visitation from Atlantic Canada did not recover to the same extent as other markets and was down by 31% compared with 2019. Visitation from Ontario was strong, representing 31% of overall visitation, up 1% compared with 2019. Visitors from Quebec accounted for 5% of visitors, down 9% compared with 2019.
Visitors from the United States accounted for 7%, down by 41% compared with 2019, while overseas visitation accounted for 5% of visitors, and was unchanged from 2019 at 86,000 visitors in 2022.
Non-resident Visitors to Nova Scotia:
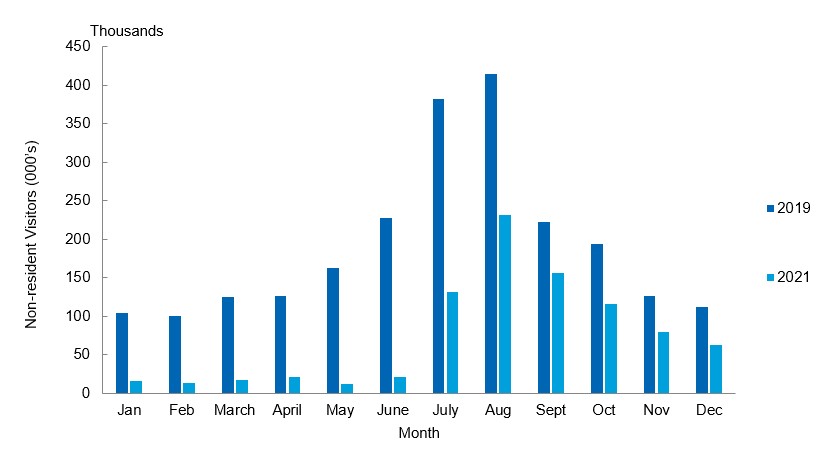
2021 Non-resident Visitation
See the 2021 Tourism Performance Report (PDF)
See 2021 Visitors by Origin (PDF)
In 2021, Nova Scotia welcomed a total of 882,600 visitors. Based on visitation estimates for 2020, visitation was up 13% in 2021 compared with the first year of the pandemic, an increase of 103,000 visitors. However, compared with 2019, before the pandemic began, visitation was down 62% (or 1.4 million fewer visitors).
Overall, Atlantic Canadians made up 50% of all non-resident visitors through 2021, while visitors from Ontario made up 30%, visitors from Quebec made up 6%, visitors from Western Canada made up 10%, and US and overseas visitors accounted for 4% of visitation.
A total of 639,300 visitors arrived by road in 2021, down 1% compared with 2020 and down 59% compared with 2019. Meanwhile, 243,300 visitors arrived by air in 2021, an increase of 82% compared with 2020, but a decrease of 68% compared with 2019.
Non-resident Visitors to Nova Scotia
About Visitation Statistics
Visitation statistics are compiled from a variety of sources, including:
- In-person surveys administered to passengers at the Halifax Stanfield International Airport
- Motor vehicle enumeration at the Nova Scotia – New Brunswick border
- Passenger information from ferry operators
- The Nova Scotia Visitor Exit Survey
- Data from Halifax International Airport Authority
- Visitor data from provincial and community visitor information centres
- Cruise passenger data from Halifax Port Authority and Sydney Ports Corporation
- Attendance data from select tourism operators
These statistics reflect the combined efforts of tourism businesses, organizations, communities, and governments, and include activities by both Nova Scotians and non-resident visitors. There are many factors that contribute to tourism industry performance including events, weather, gas prices, air capacity, currency fluctuations, geo-political circumstances, and industry initiatives such as marketing. Tourism Nova Scotia is just one organization among many contributing to tourism growth. We support tourism growth through marketing in key national and international markets, support for experience and business development, and visitor servicing. For more information about Tourism Nova Scotia's strategy and performance, please see Plans & Reports.